01
Rectify the canvas
Find the four canvas corners, remove the surroundings, and normalize the perspective before scoring.
Eval 001 · Visual estimation
Can a model tell how much of this paint-by-numbers canvas is complete? A fixed 16 × 20 grid makes it show its work across all 320 regions.
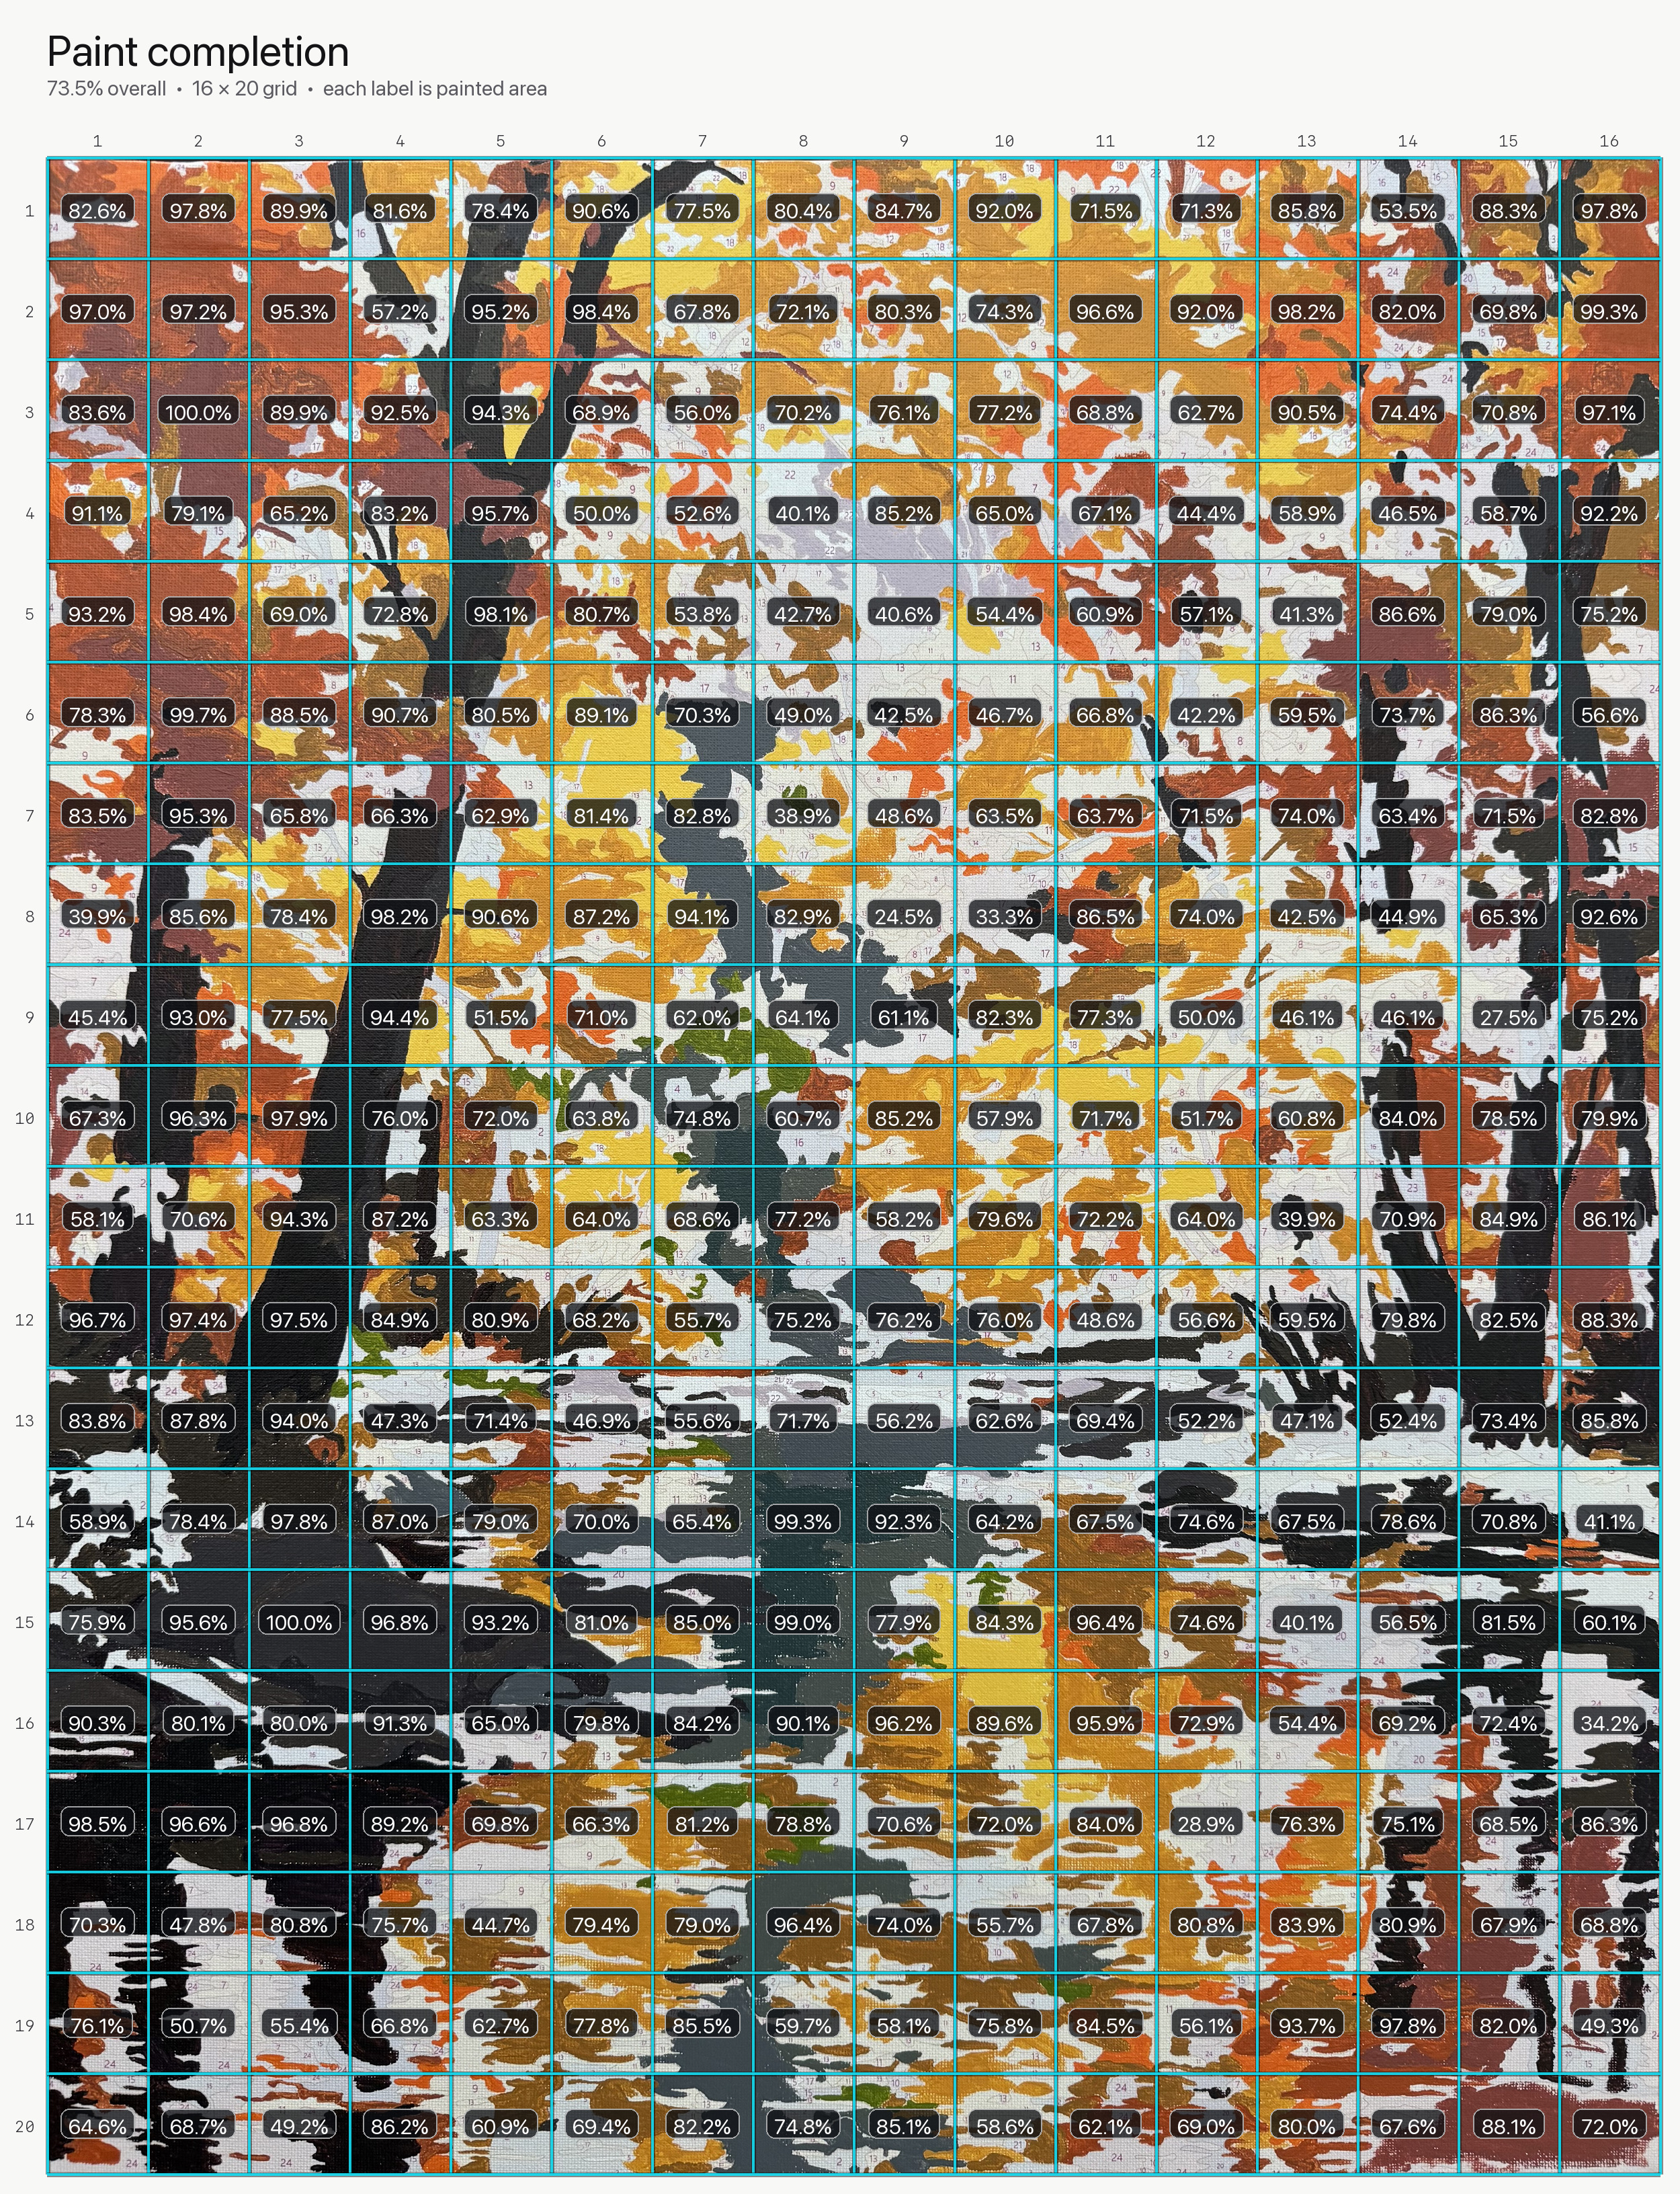 Open full resolution
Personal eval collection
Small, memorable tests run against the same models over time. Each eval keeps its prompt, evidence, and scoring method visible.
Estimate painted area cell by cell, then compare the model with a human-reviewed reference.
The evaluation
Physical inches are unnecessary. The grid is normalized to the visible canvas, which keeps the task repeatable across images, models, and reasoning settings.
Find the four canvas corners, remove the surroundings, and normalize the perspective before scoring.
Apply one 16 × 20 image-relative grid so every model evaluates the exact same regions.
Average every cell estimate into one completion score, then compare it with human-reviewed labels.
How models get compared
Average distance from the human-reviewed score in all 320 cells.
Distance between the model’s aggregate estimate and the reference.
How much the same model changes its answer when the case stays fixed.
Copy-ready protocol
You are evaluating the completion of a paint-by-numbers painting from the attached image.

Your task:

1. Identify the rectangular painting canvas.
2. Ignore everything outside the canvas, including the table, frame, easel, walls, hands, tools, shadows, and background.
3. Correct the canvas perspective so it appears straight and rectangular.
4. Divide the canvas into a normalized grid of 16 columns and 20 rows, producing exactly 320 equal-sized cells.
5. Number columns from left to right as 1–16.
6. Number rows from top to bottom as 1–20.
7. Estimate how much of each cell’s canvas area has been filled with paint.

Definition of “completed”:

- Count an area as completed when it is visibly covered with paint.
- Do not count exposed canvas, printed outlines, printed numbers, or guide markings as completed.
- Count partially painted areas in proportion to their visibly painted area.
- Do not evaluate whether the selected paint color is correct unless it is clearly accidental or unrelated.
- Apply the same standard to all 320 cells.
- If glare, blur, shadows, perspective, or low contrast affects a cell, provide your best estimate.

Required output:

First, return an annotated version of the original painting image.

The annotated image must:

- Show only the perspective-corrected painting canvas.
- Display the complete 16-column by 20-row grid.
- Preserve the original painting. Do not recreate, restyle, repaint, enhance, or replace it.
- Show a painted-completion percentage inside every grid cell.
- Format every annotation as “NN.N%”.
- Use readable, high-contrast annotation labels.
- Position each percentage near the center of its corresponding cell.
- Make grid boundaries visible without obscuring the painting.
- Show column numbers 1–16 across the top.
- Show row numbers 1–20 down the left side.
- Include exactly 320 percentage annotations.

After the annotated image, return this text summary:

Estimated painting completion: NN.N%
Confidence: NN.N%
Image quality notes: [brief list of relevant issues, or “None”]

Calculation requirements:

- Calculate the overall painting completion as the arithmetic mean of all 320 cell percentages.
- Round cell percentages and the overall percentage to one decimal place.
- Ensure the text result matches the percentages shown in the annotated image.

Output order:

1. Annotated image
2. Text summary

Do not return JSON.
Do not return the unannotated original image.
Do not provide a long explanation of your reasoning.
Next reference step